
Federal Spending 2001-2006
How often have you read and heard about federal spending cuts to antipoverty, education and other programs during President Bush’s time in office? The fact that it isn’t true doesn’t stop people from believing and repeating this myth.
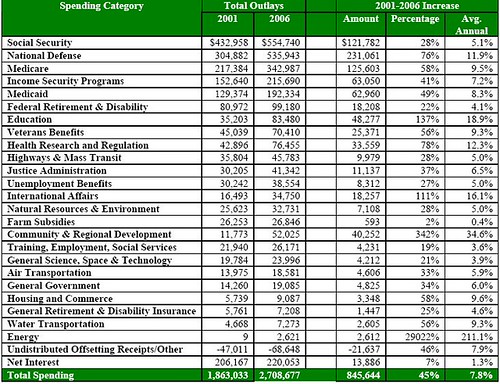
As can be seen from the chart below, federal government spending has increased in every budget category from 2001 through 2006. And federal spending has been increased dramatically in the areas where the weeping and wailing about “cuts” are generally the loudest.
So can we all agree on the definition of a few basic terms? A cut in spending is when less is spent than the previous year and an increase in spending is when more is spent than the previous year.
Assuming we are all in agreement with these basic definitions, can we now all agree there haven’t been cuts in federal spending?
Click chart to Enlarge
As can be seen from the chart below, federal government spending has increased in every budget category from 2001 through 2006. And federal spending has been increased dramatically in the areas where the weeping and wailing about “cuts” are generally the loudest.
So can we all agree on the definition of a few basic terms? A cut in spending is when less is spent than the previous year and an increase in spending is when more is spent than the previous year.
Assuming we are all in agreement with these basic definitions, can we now all agree there haven’t been cuts in federal spending?
Federal Spending By Category, 2001-2006
(Nominal $Millions)
(Nominal $Millions)

Source: Heritage Foundation calculations based on Office of Management and Budget (OMB) data.
Click chart to Enlarge
Posted by Enlighten-NewJersey @ 1:06 PM
|
![]()
![]()


0 Comments:
Post a Comment
<< Home