
National Journal's 2006 Congressional Vote Ratings
The Ridge Nightfly brings to our attention that the National Journal has released its 2006 congressional vote ratings. The Journal rates and ranks lawmakers on how they vote relative to each other on a conservative-to-liberal scale in both the Senate and the House.
The Journal’s scores are based on the members' votes in three areas: economic issues, social issues, and foreign policy. This year’s scores were based on 82 key roll-call votes in the Senate and 95 in the House during 2006.
Nightfly points out that it’s “interesting Mike Ferguson, who was portrayed by his opponent in last year's election as being a right-wing Neanderthal”, ranks right in the middle, at 221 of the 449 members of the House rated.
As you can see from the National Journal chart below, Ferguson’s liberal composite score was 47.2 and his conservative composite score was 52.8. Most people would consider those scores to reflect a moderate voting record, but not everyone.
BlueJersey blogger, huntsu, takes exception to Nightly’s observation in How The Ridge Nightfly Doth Spin:
It should be obvious the blogger doing the spinning is not Nightfly. The voting record of New Jersey’s Republican delegation would best be described as fairly moderate, with an average liberal composite score of 43 and an average conservative composite of 57. Ferguson voting record was to the left of that average, with composite scores of 47 liberal and 53 conservative.
The voting record for New Jersey's Democrats is decidedly liberal, with a delegation average composite score of 85 liberal and a conservative score of 15. Clearly, if there are New Jersey congressmen out of the mainstream, you’d find one or more of them among the Democrat’s delegation – not the Republican. We’ll be so bold to predict the same will be true next year, despite the new congress being controlled by Democrats.
Here are the ratings for New Jersey’s congressional delegation:
A score of 94 on economic issues, for example, means that the representative was more liberal than 94 percent of his or her House colleagues on key economic votes during 2006. "N/A" means the member missed more than half of the rated votes. The designations "E" and "S" and "F" refer to the "economic" and "social" and "foreign" policy votes used to determine overall ratings.
The Journal’s scores are based on the members' votes in three areas: economic issues, social issues, and foreign policy. This year’s scores were based on 82 key roll-call votes in the Senate and 95 in the House during 2006.
Nightfly points out that it’s “interesting Mike Ferguson, who was portrayed by his opponent in last year's election as being a right-wing Neanderthal”, ranks right in the middle, at 221 of the 449 members of the House rated.
As you can see from the National Journal chart below, Ferguson’s liberal composite score was 47.2 and his conservative composite score was 52.8. Most people would consider those scores to reflect a moderate voting record, but not everyone.
BlueJersey blogger, huntsu, takes exception to Nightly’s observation in How The Ridge Nightfly Doth Spin:
Ferguson may vote for the occasional environmental bill or education bill that moves him to the left, but these positions are certainly right-wing and out of mainstream in this district.Hunstu provides a list, sans links, to supposedly prove Ferguson is “out of the mainstream”. Readers are referred to the Dump Mike blog for details. The post concludes with this:
The point is that he may average to the middle because of a few carefully chosen votes, but when you are comparing him to perhaps the most conservative Congress in history (last year's, not this year's) being to the right of the middle is still pretty far to the right.If there’s something wrong with the 95 roll-call votes used, the methodology, the statistical analysis performed by the Brookings Institution or the final scores and rankings the National Journal published, hunstu doesn’t tell us. Hunstu apparently has another method for comparing voting records, but what it is we're not told.
Don't forget also that we never compared Ferguson to Neanderthals -- it's too unfair to the Neanderthals.
It should be obvious the blogger doing the spinning is not Nightfly. The voting record of New Jersey’s Republican delegation would best be described as fairly moderate, with an average liberal composite score of 43 and an average conservative composite of 57. Ferguson voting record was to the left of that average, with composite scores of 47 liberal and 53 conservative.
The voting record for New Jersey's Democrats is decidedly liberal, with a delegation average composite score of 85 liberal and a conservative score of 15. Clearly, if there are New Jersey congressmen out of the mainstream, you’d find one or more of them among the Democrat’s delegation – not the Republican. We’ll be so bold to predict the same will be true next year, despite the new congress being controlled by Democrats.
Here are the ratings for New Jersey’s congressional delegation:
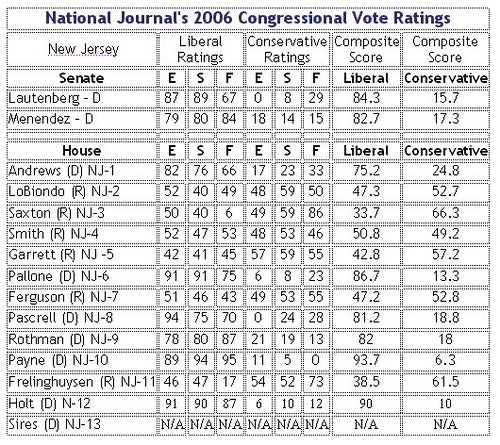
A score of 94 on economic issues, for example, means that the representative was more liberal than 94 percent of his or her House colleagues on key economic votes during 2006. "N/A" means the member missed more than half of the rated votes. The designations "E" and "S" and "F" refer to the "economic" and "social" and "foreign" policy votes used to determine overall ratings.
Labels: Blue Jersey, Congress, New Jersey, Voting Record
Posted by Enlighten-NewJersey @ 3:33 PM
|